Gallery
This gallery showcases maps generated by the scripts in the examples/ directory.
Simple Map
A basic world map showing country polygons.
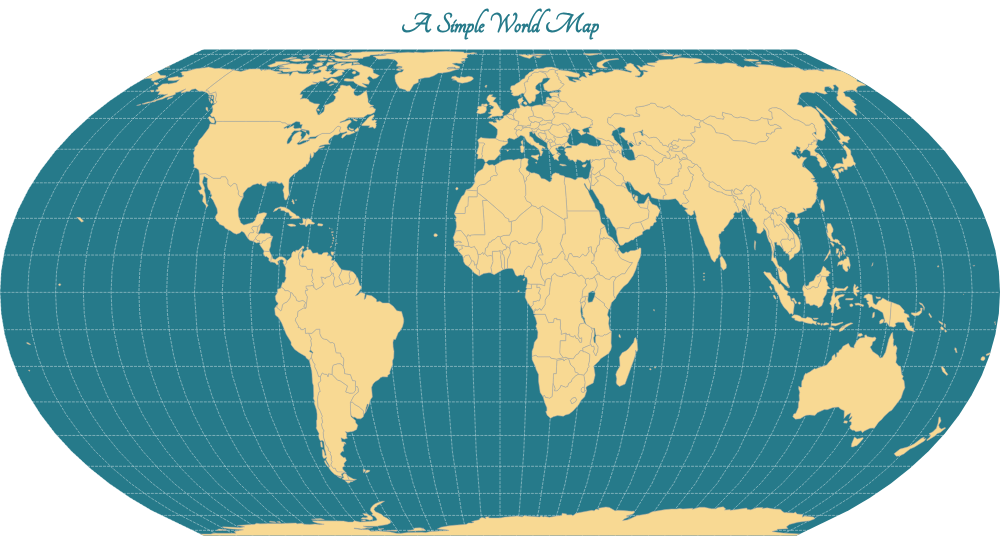
Source: examples/simple.py
"""Example script for a simple world map."""

import json
import os
from geovizpy import Geoviz

# Define output directory
output_dir = os.path.join(os.path.dirname(__file__), "html")
os.makedirs(output_dir, exist_ok=True)

# Load geojson
# Assuming running from repo root or examples folder
data_path = os.path.join(os.path.dirname(__file__), "data", "world.json")
try:
    with open(data_path) as f:
        world_data = json.load(f)
except FileNotFoundError:
    print(f"{data_path} not found.")
    world_data = {}

viz = Geoviz(projection="EqualEarth")
viz.outline(fill="#267A8A")
viz.graticule(stroke="white", strokeWidth=0.4)
viz.path(
    data=world_data,
    fill="#F8D993",
    stroke="#ada9a6",
    strokeWidth=0.5,
    tip="$NAMEen"
)
viz.header(
    fontSize=30,
    text="A Simple World Map",
    fill="#267A8A",
    fontWeight="bold",
    fontFamily="Tangerine"
)
viz.render_html(os.path.join(output_dir, "simple.html"))
Choropleth Map
A thematic map where areas are shaded in proportion to a statistical variable.
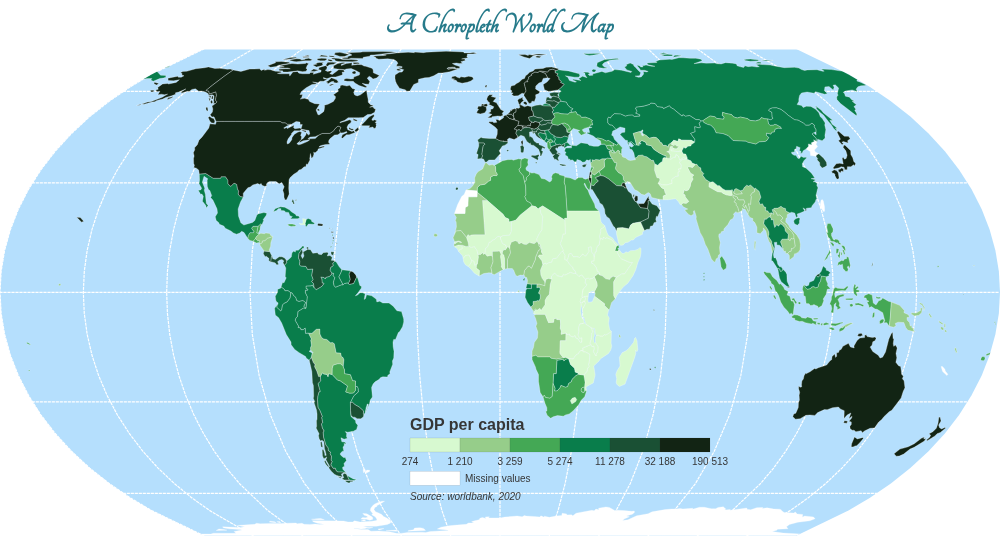
Source: examples/choropleth.py
"""Example script for a choropleth map."""

import json
import os
from geovizpy import Geoviz

# Define output directory
output_dir = os.path.join(os.path.dirname(__file__), "html")
os.makedirs(output_dir, exist_ok=True)

data_path = os.path.join(os.path.dirname(__file__), "data", "world.json")
try:
    with open(data_path) as f:
        world_data = json.load(f)
except FileNotFoundError:
    print(f"{data_path} not found.")
    world_data = {}

viz = Geoviz(projection="EqualEarth")
viz.outline()
viz.graticule(stroke="white", step=30, strokeWidth=1.2)

viz.choro(
    data=world_data,
    var="gdppc",
    strokeWidth=0.3,
    tip=True,
    leg_type="horizontal",
    leg_title="GDP per capita",
    leg_subtitle="($ per inh.)",
    leg_note="Source: worldbank, 2020",
    leg_pos=[410, 370],
    leg_values_round=0,
    leg_missing_text="Missing values"
)

viz.header(
    fontSize=30,
    text="A Choropleth World Map",
    fill="#267A8A",
    fontWeight="bold",
    fontFamily="Tangerine"
)

viz.render_html(os.path.join(output_dir, "choropleth.html"))
Bubble Map
A map using proportional symbols (bubbles) to represent data.
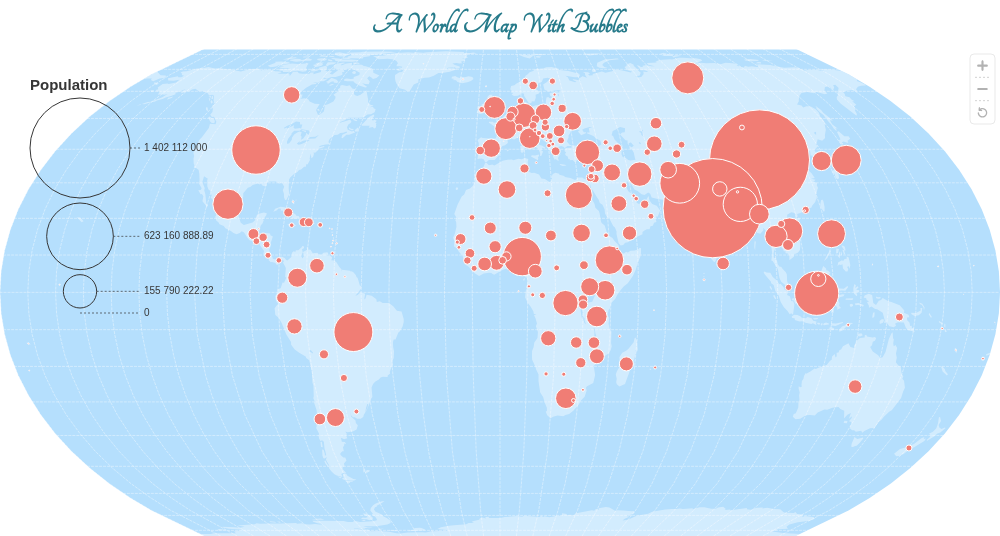
Source: examples/bubble.py
"""Example script for creating a proportional symbol map (bubble map)."""

import json
import os
from geovizpy import Geoviz

# Define output directory
output_dir = os.path.join(os.path.dirname(__file__), "html")
os.makedirs(output_dir, exist_ok=True)

data_path = os.path.join(os.path.dirname(__file__), "data", "world.json")
try:
    with open(data_path) as f:
        world_data = json.load(f)
except FileNotFoundError:
    print(f"{data_path} not found.")
    world_data = {}

viz = Geoviz(projection="EqualEarth", zoomable=True)
viz.outline()
viz.graticule(stroke="white", strokeWidth=0.4)
viz.path(datum=world_data, fill="white", fillOpacity=0.4)

# Use viz.prop instead of viz.circle to get automatic legend handling
viz.prop(
    data=world_data,
    var="pop", # 'var' is used instead of 'r' in viz.prop
    fill="#f07d75",
    tip="(d) => `${d.properties.NAMEen}\n${d.properties.pop / 1000} thousands inh.`",
    leg_type="separate",
    leg_title="Population",
    leg_pos=[30, 30], # Added position to make sure it's visible
    leg_title_fontSize=15
)

pops = [f["properties"]["pop"] for f in world_data.get("features", []) if "pop" in f["properties"]]

viz.header(
    fontSize=30,
    text="A World Map With Bubbles",
    fill="#267A8A",
    fontWeight="bold",
    fontFamily="Tangerine"
)

viz.render_html(os.path.join(output_dir, "bubble.html"))
Lines and Routes
Drawing lines (e.g., flight routes) on a map.
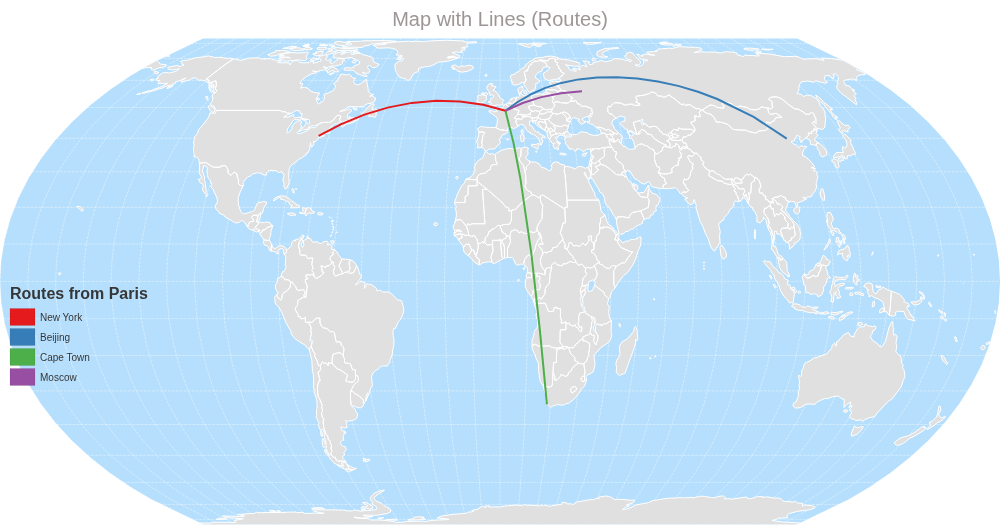
Source: examples/lines.py
"""Example script demonstrating how to draw lines on a map."""

import json
import os
from geovizpy import Geoviz

# Define output directory
output_dir = os.path.join(os.path.dirname(__file__), "html")
os.makedirs(output_dir, exist_ok=True)

data_path = os.path.join(os.path.dirname(__file__), "data", "world.json")
try:
    with open(data_path) as f:
        world_data = json.load(f)
except FileNotFoundError:
    print(f"{data_path} not found.")
    world_data = {}

lines_data = {
    "type": "FeatureCollection",
    "features": [
        {
            "type": "Feature",
            "properties": {"destination": "New York", "type": "Long-haul"},
            "geometry": {
                "type": "LineString",
                "coordinates": [[2.35, 48.85], [-74.00, 40.71]]
            }
        },
        {
            "type": "Feature",
            "properties": {"destination": "Beijing", "type": "Long-haul"},
            "geometry": {
                "type": "LineString",
                "coordinates": [[2.35, 48.85], [116.40, 39.90]]
            }
        },
        {
            "type": "Feature",
            "properties": {"destination": "Cape Town", "type": "Long-haul"},
            "geometry": {
                "type": "LineString",
                "coordinates": [[2.35, 48.85], [18.42, -33.92]]
            }
        },
        {
            "type": "Feature",
            "properties": {"destination": "Moscow", "type": "Medium-haul"},
            "geometry": {
                "type": "LineString",
                "coordinates": [[2.35, 48.85], [37.61, 55.75]]
            }
        }
    ]
}

viz = Geoviz(projection="EqualEarth")
viz.outline()
viz.graticule(stroke="white", strokeWidth=0.4)

viz.path(datum=world_data, fill="#e0e0e0", stroke="white")

viz.typo(
    data=lines_data,
    var="destination",
    colors="Set1",
    strokeWidth=2,
    fill="none",
    leg_title="Routes from Paris",
    leg_pos=[10, 250]
)

viz.header(text="Map with Lines (Routes)", fontSize=20)
viz.render_html(os.path.join(output_dir, "lines.html"))
Tile Layers
Using a tile basemap (e.g., OpenStreetMap, World Street Map).
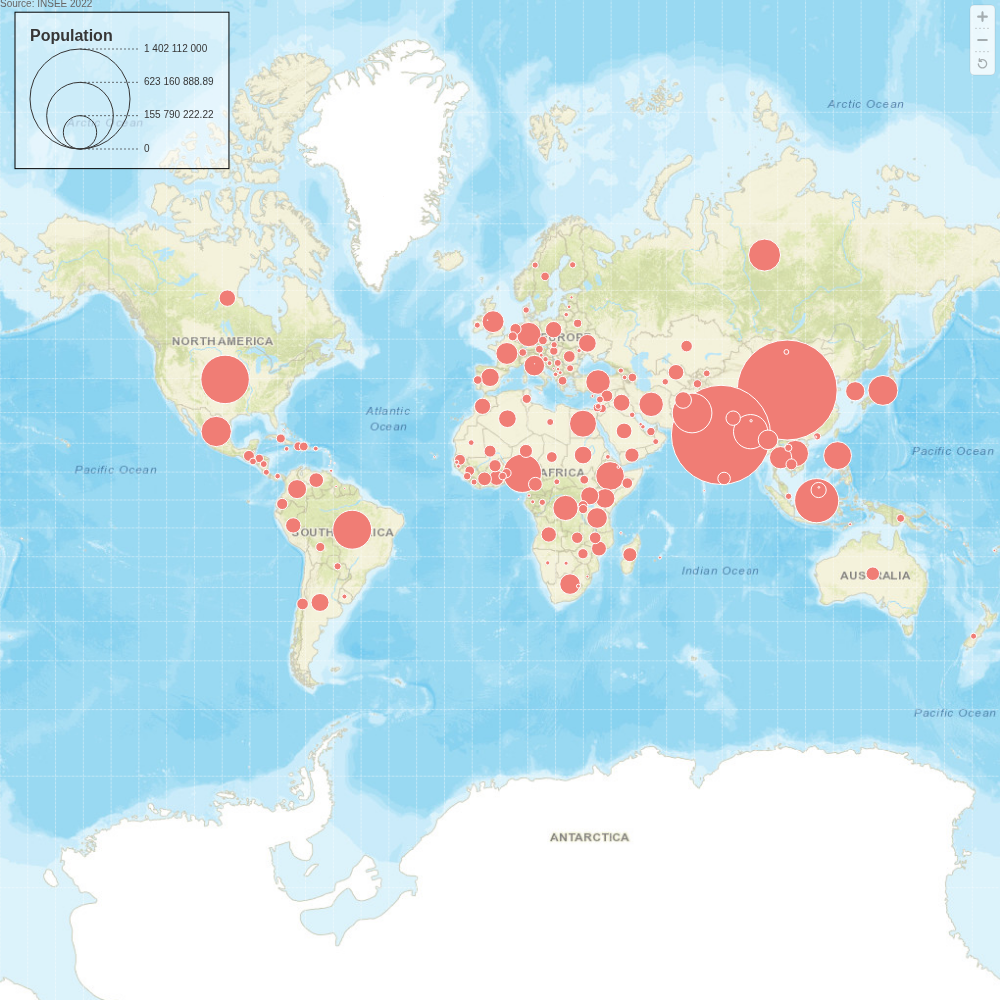
Source: examples/tiles.py
"""Example script demonstrating how to use tile layers."""

import json
import os
from geovizpy import Geoviz

# Define output directory
output_dir = os.path.join(os.path.dirname(__file__), "html")
os.makedirs(output_dir, exist_ok=True)

data_path = os.path.join(os.path.dirname(__file__), "data", "world.json")
try:
    with open(data_path) as f:
        world_data = json.load(f)
except FileNotFoundError:
    print(f"Data file not found: {data_path}")
    world_data = {}

viz = Geoviz(projection="mercator", zoomable=True)

# Use the keyword for the tile layer, as per geoviz.js documentation
viz.tile(url="worldStreet")

viz.graticule(stroke="white", strokeWidth=0.4)

# This line might fail if world_data is empty
if world_data:
    viz.prop(
        data=world_data,
        var="pop",
        fill="#f07d75",
        tip="$NAMEen",
        leg_title="Population",
        leg_frame=True,
        leg_pos=[30, 30]
    )

viz.text(
    pos=[0,0],
    text="Source: INSEE 2022",
    fontSize=10,
    fill="#666",
    anchor="end"
)


viz.render_html(os.path.join(output_dir, "tiles.html"))
Labels
Adding text labels to map features.
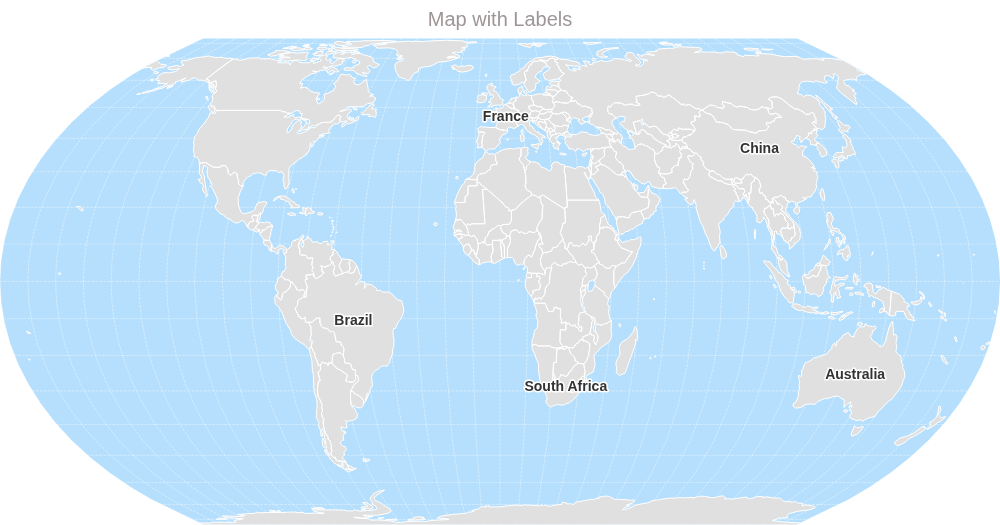
Source: examples/labels.py
"""Example script for adding text labels to a map."""

import json
import os
from geovizpy import Geoviz

# Define output directory
output_dir = os.path.join(os.path.dirname(__file__), "html")
os.makedirs(output_dir, exist_ok=True)

data_path = os.path.join(os.path.dirname(__file__), "data", "world.json")
try:
    with open(data_path) as f:
        world_data = json.load(f)
except FileNotFoundError:
    print(f"{data_path} not found.")
    world_data = {}

countries_to_label = ["Brazil", "China", "United States", "France", "South Africa", "Australia"]
labeled_features = [f for f in world_data.get("features", []) if f["properties"].get("NAMEen") in countries_to_label]
labeled_data = {"type": "FeatureCollection", "features": labeled_features}

viz = Geoviz(projection="EqualEarth")
viz.outline()
viz.graticule(stroke="white", strokeWidth=0.4)

viz.path(datum=world_data, fill="#e0e0e0", stroke="white")

viz.text(
    data=labeled_data,
    text="NAMEen",
    fill="#333",
    fontSize=14,
    fontWeight="bold",
    stroke="white",
    strokeWidth=3,
    paintOrder="stroke"
)


viz.header(text="Map with Labels", fontSize=20)
viz.render_html(os.path.join(output_dir, "labels.html"))
Visual Effects
Applying effects like shadows to specific layers.
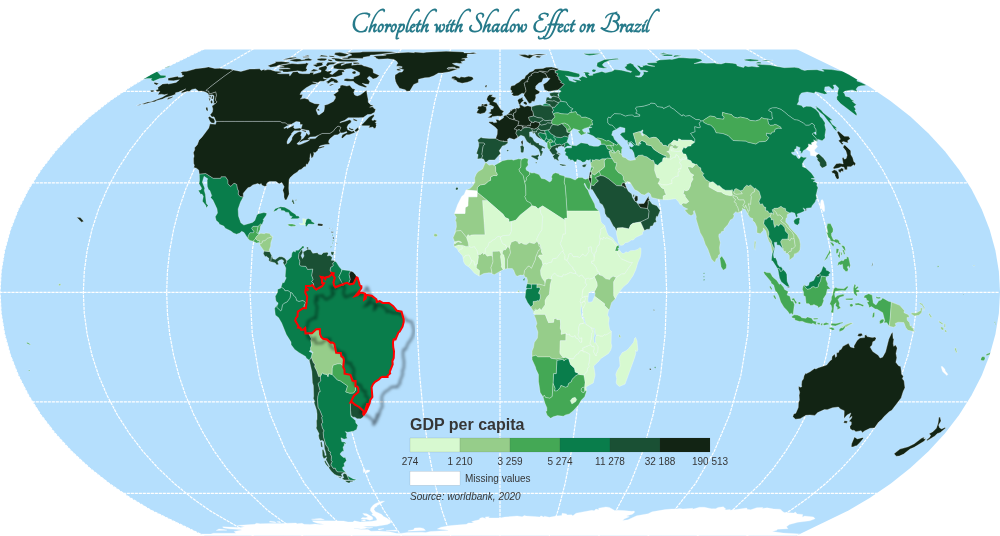
Source: examples/choropleth_effect.py
"""Example script demonstrating visual effects (shadow)."""

import json
import os
from geovizpy import Geoviz

# Define output directory
output_dir = os.path.join(os.path.dirname(__file__), "html")
os.makedirs(output_dir, exist_ok=True)

data_path = os.path.join(os.path.dirname(__file__), "data", "world.json")
try:
    with open(data_path) as f:
        world_data = json.load(f)
except FileNotFoundError:
    print(f"{data_path} not found.")
    world_data = {}

brazil = {
    "type": "FeatureCollection",
    "features": [f for f in world_data.get("features", []) if f["properties"].get("NAMEen") == "Brazil"]
}

viz = Geoviz(projection="EqualEarth")

viz.effect_shadow(id="myshadow", dx=10, dy=10, opacity=0.5)

viz.outline()
viz.graticule(stroke="white", step=30, strokeWidth=1.2)

viz.choro(
    data=world_data,
    var="gdppc",
    strokeWidth=0.3,
    tip=True,
    leg_type="horizontal",
    leg_title="GDP per capita",
    leg_subtitle="($ per inh.)",
    leg_note="Source: worldbank, 2020",
    leg_pos=[410, 370],
    leg_values_round=0,
    leg_missing_text="Missing values"
)

if brazil["features"]:
    viz.path(
        data=brazil,
        fill="none",
        stroke="red",
        strokeWidth=2,
        filter="url(#myshadow)"
    )

viz.header(
    fontSize=30,
    text="Choropleth with Shadow Effect on Brazil",
    fill="#267A8A",
    fontWeight="bold",
    fontFamily="Tangerine"
)

viz.render_html(os.path.join(output_dir, "choropleth_effect.html"))
Layer Control
An interactive map with controls to toggle layer visibility.
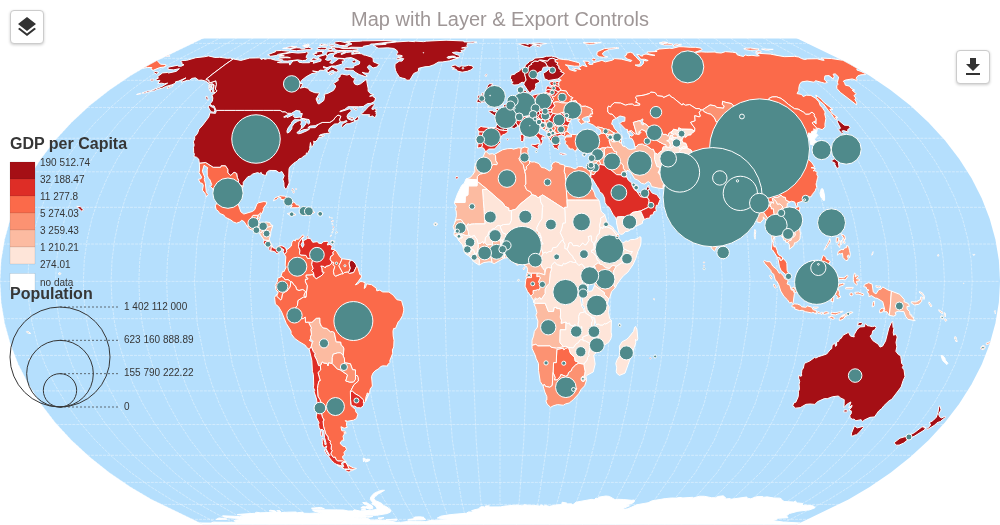
Source: examples/layer_control.py
"""Example script for layer control and export functionality."""

import json
import os
from geovizpy import Geoviz

# Define output directory
output_dir = os.path.join(os.path.dirname(__file__), "html")
os.makedirs(output_dir, exist_ok=True)

# Load world data
data_path = os.path.join(os.path.dirname(__file__), "data", "world.json")
try:
    with open(data_path) as f:
        world_data = json.load(f)
except FileNotFoundError:
    print(f"{data_path} not found.")
    world_data = {}

# Create a map
viz = Geoviz(projection="EqualEarth", zoomable=True)
viz.outline(id="outline")
viz.graticule(stroke="white", strokeWidth=0.4, id="graticule")

# Add a choropleth layer with an ID and legend position
viz.choro(
    data=world_data,
    var="gdppc",
    colors="Reds",
    id="choropleth_gdp",
    legend=True,
    leg_title="GDP per Capita",
    leg_pos=[10, 100]  # Position for the choro legend
)

# Add a proportional symbol layer with an ID and legend position
viz.prop(
    data=world_data,
    var="pop",
    fill="#4f8a8b",
    stroke="white",
    id="prop_population",
    legend=True,
    leg_title="Population",
    leg_pos=[10, 250]  # Position for the prop legend
)

# Add the layer control widget (hover to expand)
viz.add_layer_control(
    layers=["choropleth_gdp", "prop_population", "graticule"],
    title="Layers",
    x=10,
    y=10
)

# Add the export control widget (hover to expand)
viz.add_export_control(
    pos="top-right" # Or use x, y
)

# Add opacity control for multiple layers
viz.add_opacity_control(
    layers=["choropleth_gdp", "prop_population"],
    title="Layers Opacity",
    x=10,
    y=90
)

viz.header(text="Map with Layer & Export Controls", fontSize=20)
viz.render_html(os.path.join(output_dir, "layer_control_map.html"))
Reactive Map
A map configured for zooming and interaction.
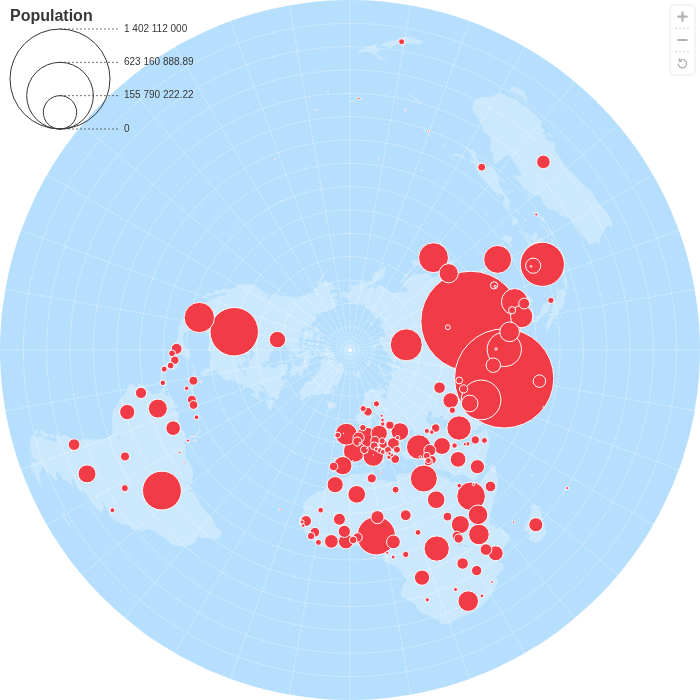
Source: examples/reactive.py
"""Example script for a reactive map (zoomable)."""

import json
import os
from geovizpy import Geoviz

# Define output directory
output_dir = os.path.join(os.path.dirname(__file__), "html")
os.makedirs(output_dir, exist_ok=True)

data_path = os.path.join(os.path.dirname(__file__), "data", "world.json")
try:
    with open(data_path) as f:
        world_data = json.load(f)
except FileNotFoundError:
    print(f"{data_path} not found.")
    world_data = {}

viz = Geoviz(projection="polar", width=700, zoomable=True)
viz.outline()
viz.graticule(stroke="white", strokeWidth=0.4)
viz.path(datum=world_data, fill="white", fillOpacity=0.3)

viz.prop(
    id="bubbles",
    symbol="circle",
    data=world_data,
    var="pop",
    fill="#F13C47",
    dodge=False,
    k=50,
    leg_title="Population",
    tip=True
)

print("Generating a static snapshot of the map.")
viz.render_html(os.path.join(output_dir, "reactive_snapshot.html"))
Advanced Plots
Examples of more complex plot types.
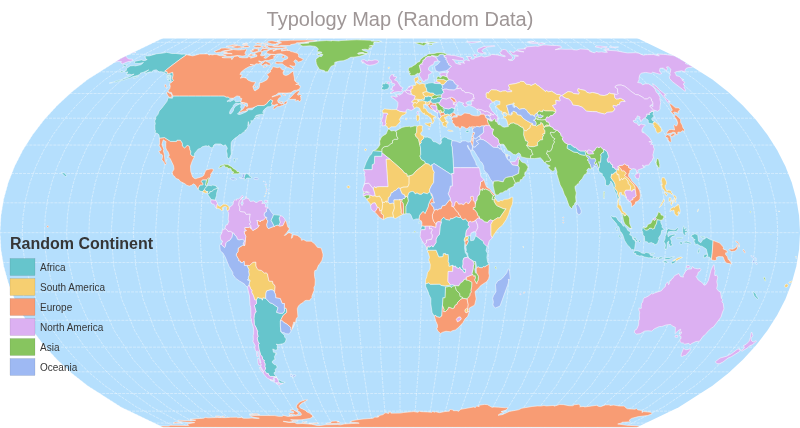
Typology Map
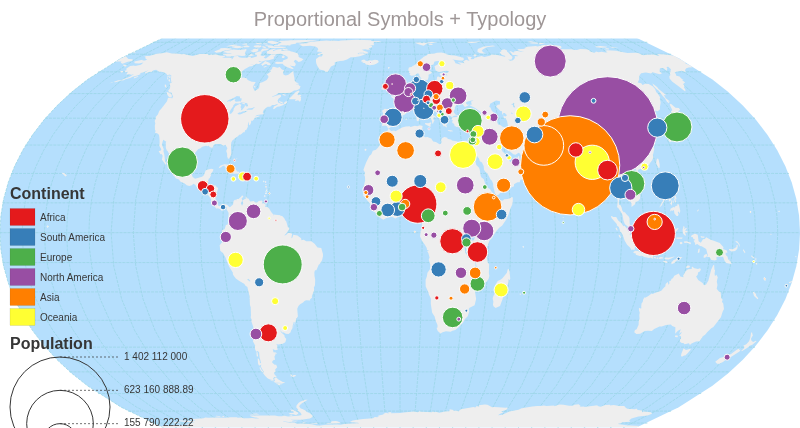
Proportional Symbols + Typology
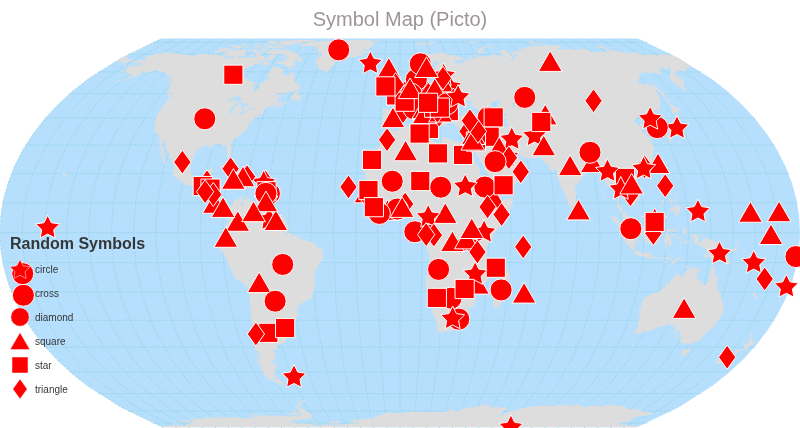
Symbol Map (Picto)
Source: examples/advanced_plots.py
"""Example script demonstrating advanced plot types."""

import json
import os
import random
from geovizpy import Geoviz

# Define output directory
output_dir = os.path.join(os.path.dirname(__file__), "html")
os.makedirs(output_dir, exist_ok=True)

data_path = os.path.join(os.path.dirname(__file__), "data", "world.json")
try:
    with open(data_path) as f:
        world_data = json.load(f)
except FileNotFoundError:
    print(f"{data_path} not found.")
    world_data = {}

continents = ["Africa", "Asia", "Europe", "North America", "South America", "Oceania"]
symbols_list = ["star", "circle", "cross", "diamond", "square", "triangle"]

for f in world_data.get("features", []):
    f["properties"]["random_continent"] = random.choice(continents)
    f["properties"]["random_symbol"] = random.choice(symbols_list)

# 1. Typology Map
viz1 = Geoviz(projection="EqualEarth", width=800)
viz1.outline()
viz1.graticule(stroke="white", strokeWidth=0.4)

viz1.typo(
    data=world_data,
    var="random_continent",
    colors="Pastel",
    strokeWidth=0.5,
    leg_title="Random Continent",
    leg_pos=[10, 200]
)
viz1.header(text="Typology Map (Random Data)", fontSize=20)
viz1.render_html(os.path.join(output_dir, "advanced_typo.html"))

# 2. Proportional Symbols with Typology
viz2 = Geoviz(projection="EqualEarth", width=800)
viz2.outline()
viz2.graticule()
viz2.path(datum=world_data, fill="#eee")

viz2.proptypo(
    data=world_data,
    var1="pop",
    var2="random_continent",
    k=50,
    colors="Set1",
    leg1_title="Population",
    leg2_title="Continent",
    leg1_pos=[10, 300],
    leg2_pos=[10, 150]
)
viz2.header(text="Proportional Symbols + Typology", fontSize=20)
viz2.render_html(os.path.join(output_dir, "advanced_proptypo.html"))

# 3. Symbol Map
viz3 = Geoviz(projection="EqualEarth", width=800)
viz3.outline()
viz3.graticule()
viz3.path(datum=world_data, fill="#ddd")

viz3.picto(
    data=world_data,
    var="random_symbol",
    symbols=["star", "circle", "cross", "diamond", "square", "triangle"],
    colors="black",
    fill="red",
    stroke="white",
    strokeWidth=1,
    k=15,
    leg_title="Random Symbols",
    leg_pos=[10, 200]
)
viz3.header(text="Symbol Map (Picto)", fontSize=20)
viz3.render_html(os.path.join(output_dir, "advanced_symbol.html"))
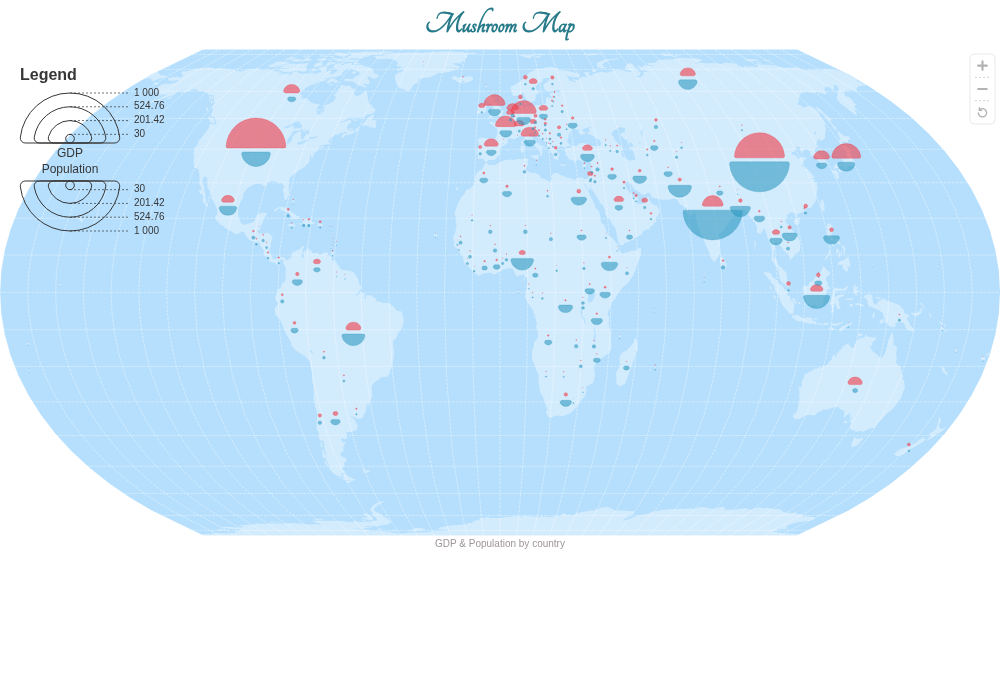
Mushroom Map
A map combining two half-circles (GDP and Population) to form mushroom symbols.
Source: examples/mushroom.py
"""Example script for creating a mushroom map (GDP vs Population)."""

import json
import os
from geovizpy import Geoviz

# Define output directory
output_dir = os.path.join(os.path.dirname(__file__), "html")
os.makedirs(output_dir, exist_ok=True)

data_path = os.path.join(os.path.dirname(__file__), "data", "world.json")
try:
    with open(data_path) as f:
        world_data = json.load(f)
except FileNotFoundError:
    print(f"{data_path} not found.")
    world_data = {}

dy = 2

viz = Geoviz(projection="EqualEarth", zoomable=True)
viz.outline()
viz.graticule(stroke="white", strokeWidth=0.4)
viz.path(datum=world_data, fill="white", fillOpacity=0.4)

# Top half-circle: GDP
viz.halfcircle(
    data=world_data,
    r="gdp",
    k=30,
    dy=-dy,
    fill="#F13C47",
    stroke="#F13C47",
    strokeWidth=0.3,
    fillOpacity=0.6,
    tip="(d) => `${d.properties.NAMEen}\nGDP: ${Math.round(+d.properties.gdp / 1e6)} M$`",
    id="gdp",
)

# Bottom half-circle: Population
viz.halfcircle(
    data=world_data,
    r="pop",
    k=30,
    dy=dy,
    angle=180,
    fill="#319ABF",
    stroke="#319ABF",
    strokeWidth=0.3,
    fillOpacity=0.6,
    tip="(d) => `${d.properties.NAMEen}\nPop: ${Math.round(+d.properties.pop / 1e3)} k`",
    id="pop",
)

# Mushroom legend
viz.legend_mushrooms(
    pos=[20, 20],
    top_title="GDP",
    top_fill="#F13C47",
    bottom_title="Population",
    bottom_fill="#319ABF",
    top_txt="len per year",
    bottom_txt="len inhabitants",
)

viz.header(
    fontSize=30,
    text="Mushroom Map",
    fill="#267A8A",
    fontWeight="bold",
    fontFamily="Tangerine",
)

viz.footer(text="GDP & Population by country")

viz.render_html(os.path.join(output_dir, "mushroom.html"))
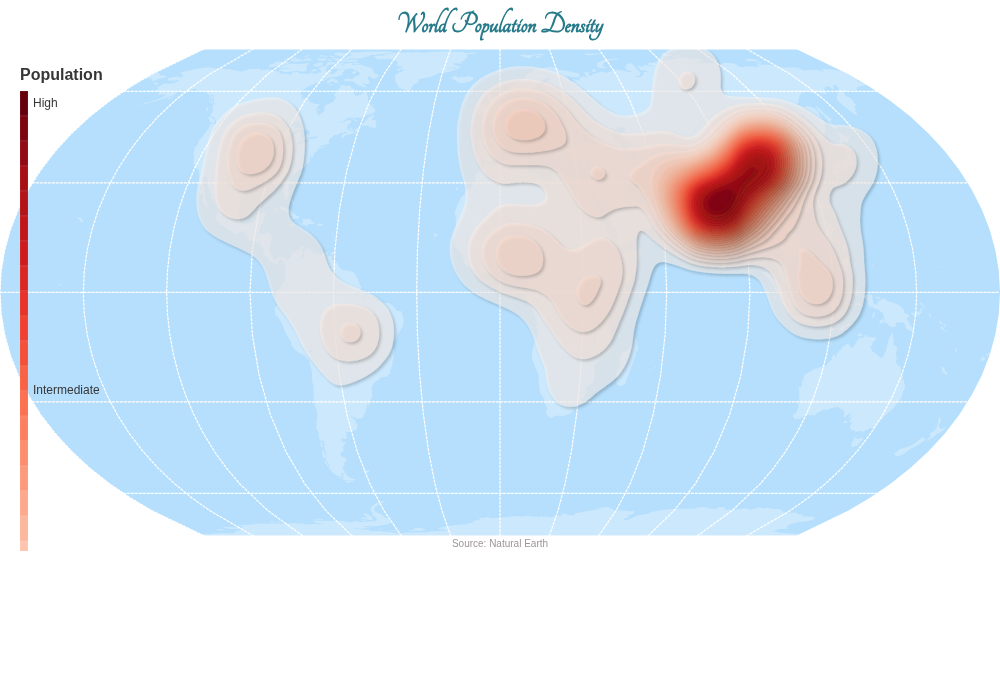
Heatmap / Smooth
A density map using isobands to visualize population distribution.
Source: examples/heatmap.py
"""Example script for a smooth/heatmap density map."""

import json
import os
from geovizpy import Geoviz

# Define output directory
output_dir = os.path.join(os.path.dirname(__file__), "html")
os.makedirs(output_dir, exist_ok=True)

data_path = os.path.join(os.path.dirname(__file__), "data", "world.json")
try:
    with open(data_path) as f:
        world_data = json.load(f)
except FileNotFoundError:
    print(f"{data_path} not found.")
    world_data = {}

viz = Geoviz(projection="EqualEarth")
viz.outline()
viz.graticule(stroke="white", step=30, strokeWidth=1.2)
viz.path(data=world_data, fill="white", fillOpacity=0.3, stroke="none")

viz.smooth(
    data=world_data,
    var="pop",
    colors="Reds",
    bandwidth=25,
    thresholds=30,
    cellSize=2,
    fillOpacity=0.5,
    strokeOpacity=0.1,
    leg_title="Population",
    leg_pos=[20, 20],
)

viz.header(
    fontSize=30,
    text="World Population Density",
    fill="#267A8A",
    fontWeight="bold",
    fontFamily="Tangerine",
)

viz.footer(text="Source: Natural Earth")

viz.render_html(os.path.join(output_dir, "heatmap.html"))
JSON Export
Exporting the map configuration to JSON for use in other applications.
Source: examples/json_export.py
"""Example script for exporting the map configuration to JSON."""

import json
import os
from geovizpy import Geoviz

# Define output directory
output_dir = os.path.join(os.path.dirname(__file__), "html")
os.makedirs(output_dir, exist_ok=True)

data_path = os.path.join(os.path.dirname(__file__), "data", "world.json")
try:
    with open(data_path) as f:
        world_data = json.load(f)
except FileNotFoundError:
    print(f"{data_path} not found.")
    world_data = {}

viz = Geoviz(projection="EqualEarth")
viz.outline()
viz.graticule(stroke="white", strokeWidth=0.4)
viz.choro(
    data=world_data,
    var="gdppc",
    strokeWidth=0.3,
    tip=True,
    leg_title="GDP per capita"
)
viz.header(text="Map from JSON Config", fontSize=30)

config_json = viz.to_json()
print("Configuration JSON (first 500 chars):")
print(config_json[:500] + "...")

with open(os.path.join(output_dir, "map_config.json"), "w") as f:
    f.write(config_json)
print(f"\nConfiguration saved to {os.path.join(output_dir, 'map_config.json')}")